Humans aren’t good at some things, like perfect recall of events,

or creating enduring fashion,

or, for this post, understanding math.

The math in question is exponential growth, and it’s what’s occurring in the Covid-19 spread. It is not something that as humans walking around, driving our cars, or buying groceries, we see often. Thus, we’re not attuned to what it means. We don’t see a bamboo tree grow one inch one day and then 1 foot the next and 10 feet the next.
Internationally, the Covid-19 virus is currently increasing at about 8% to 10% per day, compounding. This number is of course limited by how many people can be tested, and whether governments want to tell you what’s really going on.
We are not sure, really, of the denominator of Covid-19 cases well enough to understand its virality and mortality rates. It seems at the moment to be as contagious as the flu we all know and love, and about 20 times more deadly. That would mean in the US, we could imagine an annual 30m to 40m cases (similar to the annual flu), and up to one million deaths per year. That would be somewhere between 1 in 50 and 1 in 30 deaths. At my son’s high school of about 750 students, that’s 15 to 20 dead high schoolers (although, older folks appear to be more at risk than younger, healthy folks). That’s the demographics for this disease, anyway. Spanish Influenza and Zika had different demographics.
Here’s the non-China growth of Covid-19 cases as of yesterday:
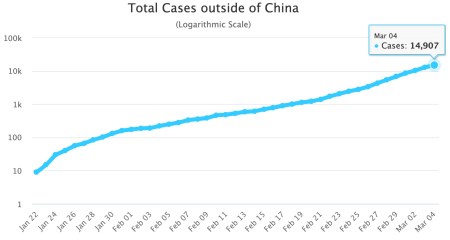
That doesn’t look too bad. (Here’s the source of this data, and thanks to Dominic Hughes for the link)
But notice the Y axis. That’s a log scale, a 10x increase for each horizontal line. Currently, cases are increasing by a factor of 10 every 15 days or so. By this time next week, you’ll see the headline of “Cases of Covid Outside China Now Exceed Those Inside” or some such.
Now, let’s wrap our human brains around this math:
March 15 = 100,000 cases
March 30 = 1,000,000 cases
April 15 = 10,000,000 cases
April 30 = 100,000,000 cases
May 15 = 1 Billion cases
That’s what exponential growth looks like. Now, before we all head to our underground bunkers, most epidemics don’t look like that. They look like a bell curve. We tend to change our behavior, quarantine, don’t shake hands, and the spread of disease levels off and then decreases. Here’s an epidemic curve for the 2003 SARS outbreak, for example.
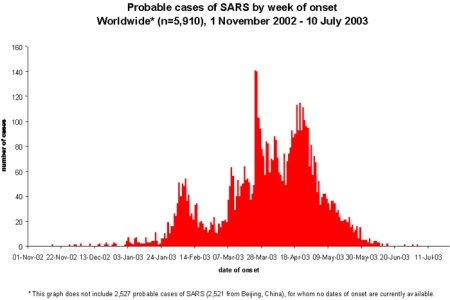
What we are looking for, then, is when the exponential growth starts to level off, and then decline. That’s when we’ll know we’re improving — for this season.
Right. For this season.
It is possible this is not a one-and-done thing. Covid could be multi-seasonal. The 1918 Spanish Influenza epidemic (h1N1) had a mild first season in spring of 1918, but went on to infect 500 million people worldwide (1/3rd of the world population at the time, so gross that up to 4 billion in current terms) and killed 10% of those infected. Any vaccine for Covid-19 will not be ready until after this coming fall-winter 2020 flu season.
There is a lot we don’t know. We need be cautious, but not panicky. Wash your hands for 20 seconds, often. Don’t wear a mask unless you are already infected. If you haven’t had a flu shot, get one. It doesn’t help for Covid-19 but catching Covid-19 while already sick with the flu is worse than being healthy and doing so.
